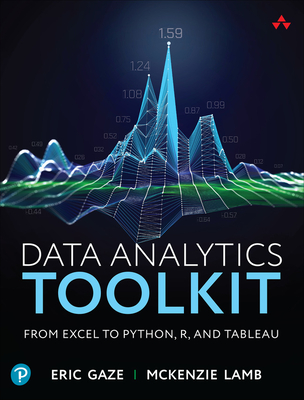
Data Analytics Toolkit: From Excel to Python, R, and Tableau
暫譯: 數據分析工具包:從 Excel 到 Python、R 和 Tableau
Gaze, Eric, Lamb, McKenzie
- 出版商: Addison Wesley
- 出版日期: 2026-07-28
- 售價: $2,340
- 貴賓價: 9.5 折 $2,223
- 語言: 英文
- 頁數: 544
- 裝訂: Quality Paper - also called trade paper
- ISBN: 0135397863
- ISBN-13: 9780135397862
-
相關分類:
Data-visualization
海外代購書籍(需單獨結帳)
相關主題

商品描述
Master Four Essential Platforms--One Problem at a Time
In today's data-driven business landscape, the ability to extract insights from information is no longer optional--it's essential. Yet many professionals find themselves trapped between the familiar comfort of spreadsheets and the untapped potential of more powerful analytics platforms. Data Analytics Toolkit: From Excel to Python, R, and Tableau bridges that critical gap, transforming you from a spreadsheet user into a confident, multi-platform data analyst.
Whether you're analyzing financial transactions, tracking election trends, monitoring public health crises, or evaluating investment portfolios, the tools you choose determine both the speed and quality of your insights. This book teaches you to think beyond any single platform by solving the same real-world problems using Excel, Tableau, Python, and R, revealing which tool excels in different situations and why.
Through hands-on case studies based on authentic datasets, you'll develop practical proficiency across four complementary platforms. You'll understand not just how to create visualizations and perform analyses, but why different tools handle tasks differently. This deeper comprehension prepares you to adapt quickly to emerging technologies and make strategic decisions about which platform serves your analytical goals best.
- Foundational Skills Across Platforms: Master data import, transformation, and visualization in Excel, Tableau, Python, and R using parallel examples that illuminate each tool's strengths
- Real-World Case Studies: Work with authentic datasets spanning banking, demographics, elections, public health, historical analysis, education, and financial markets
- Data Wrangling Essentials: Learn to clean, reshape, and prepare data for analysis, addressing common formatting challenges that trip up beginners
- Statistical Aggregation and Grouping: Understand how each platform handles data aggregation, from pivot tables to coding-based transformations
- Interactive Visualization Design: Create compelling graphics that tell stories, from basic charts to filtered, multi-dimensional dashboards
- Learning from Mistakes: Discover common pitfalls and debugging strategies that accelerate your journey toward proficiency
- Conceptual Foundations for Tomorrow's Tools: Build principles-based understanding that transfers to AI-enhanced analytics platforms and future software innovations
Rather than memorizing software instructions that become obsolete, you'll develop analytical thinking that transcends any single tool. By comparing approaches across platforms, you'll gain the conceptual foundation needed to guide AI tools effectively, evaluate their outputs critically, and adapt solutions to new contexts. Whether you're a student beginning your data analytics journey or a professional seeking to expand your toolkit, this book equips you to work fluently across today's platforms and approach tomorrow's with confidence and curiosity.
Ready to unlock the full potential of your data? Start your transformation today.
商品描述(中文翻譯)
掌握四大基本平台——一次解決一個問題
在當今以數據為驅動的商業環境中,從信息中提取洞察的能力已不再是可選的——而是必須的。然而,許多專業人士發現自己被熟悉的電子表格所困住,與更強大的分析平台的潛力之間存在著未被開發的差距。數據分析工具包:從 Excel 到 Python、R 和 Tableau彌補了這一關鍵差距,將您從一名電子表格使用者轉變為一名自信的多平台數據分析師。
無論您是在分析金融交易、追蹤選舉趨勢、監控公共健康危機,還是評估投資組合,您所選擇的工具都會影響您洞察的速度和質量。本書教您超越任何單一平台的思維,通過使用 Excel、Tableau、Python 和 R 解決相同的現實問題,揭示在不同情況下哪種工具表現最佳及其原因。
通過基於真實數據集的實踐案例研究,您將在四個互補平台上發展實用的熟練度。您不僅會了解如何創建可視化和執行分析,還會理解為什麼不同的工具處理任務的方式不同。這種更深層的理解使您能夠快速適應新興技術,並對哪個平台最能滿足您的分析目標做出戰略決策。
-
跨平台的基礎技能:掌握在 Excel、Tableau、Python 和 R 中進行數據導入、轉換和可視化的技能,使用平行示例來闡明每個工具的優勢 -
真實案例研究:使用涵蓋銀行、人口統計、選舉、公共健康、歷史分析、教育和金融市場的真實數據集進行工作 -
數據處理基礎:學習清理、重塑和準備數據以進行分析,解決初學者常見的格式挑戰 -
統計聚合與分組:了解每個平台如何處理數據聚合,從樞紐表到基於代碼的轉換 -
互動可視化設計:創建引人入勝的圖形來講述故事,從基本圖表到過濾的多維儀表板 -
從錯誤中學習:發現常見的陷阱和調試策略,加速您邁向熟練的旅程 -
未來工具的概念基礎:建立基於原則的理解,這些理解可以轉移到 AI 增強的分析平台和未來的軟體創新上
與其記憶會過時的軟體指令,您將發展出超越任何單一工具的分析思維。通過比較跨平台的方法,您將獲得指導 AI 工具的概念基礎,有效評估其輸出,並將解決方案適應於新情境。無論您是剛開始數據分析之旅的學生,還是希望擴展工具包的專業人士,本書都將使您能夠在當今的平台上流利工作,並以信心和好奇心面對未來的平台。
準備好釋放您數據的全部潛力了嗎?今天就開始您的轉變。
作者簡介
Eric Gaze directs the Quantitative Reasoning (QR) program in the Baldwin Center for Learning and Teaching at Bowdoin College and is a senior lecturer in the Mathematics Department, teaching courses in QR and data visualization. He is the author of Thinking Quantitatively: Communicating with Numbers, Third Edition (Pearson, 2023), and was the principal investigator for an NSF TUES Type I grant (2012-2014), Quantitative Literacy and Reasoning Assessment (QLRA) DUE 1140562.
McKenzie Lamb is the Lee G. Hall Distinguished Visiting Professor of Mathematical Sciences and Retention Analyst at DePauw University. He previously served as professor and chair of the Mathematical Sciences Department at Ripon College. He is a coauthor of Knots, Molecules, and the Universe: An Introduction to Topology (American Mathematical Society, 2016).
作者簡介(中文翻譯)
埃瑞克·蓋茲 目前在鮑登學院的巴爾德溫學習與教學中心負責定量推理(QR)計畫,並擔任數學系的高級講師,教授定量推理和數據視覺化的課程。他是《定量思考:用數字溝通(第三版)》(Pearson, 2023) 的作者,並曾擔任國家科學基金會(NSF)TUES Type I 資助(2012-2014)的主要研究者,該計畫名為定量素養與推理評估(QLRA)DUE 1140562。
麥肯齊·蘭姆 是德保大學的李·G·霍爾數學科學傑出訪問教授及留任分析師。他曾擔任瑞朋學院數學科學系的教授及系主任。他是《結、分子與宇宙:拓撲學導論》(美國數學學會,2016)的共同作者。